S&P 500 and Nasdaq-100 Flashed Death Crosses—Should You Worry?
The S&P 500 Index, as tracked by SPDR S&P 500 ETF Trust (NYSEARCA: SPY), and the Nasdaq-100 Index, as tracked by the Invesco QQQ (NASDAQ: QQQ), have both triggered a widely-followed bearish chart pattern known as the Death Cross.
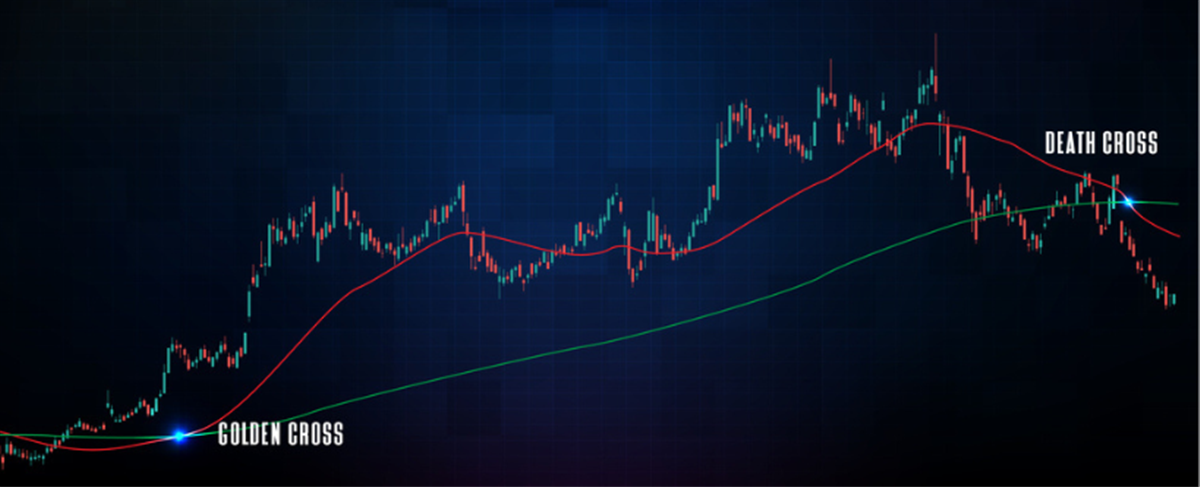
A Death Cross occurs when a 50-day simple moving average (SMA) trendline crosses below the 200-day SMA trendline.
But does this ominous-sounding pattern really mean a bear market is inevitable?
Death Cross: Signal or Noise?
The pattern, when formed, is an omen of sorts predicting an upcoming bear market. This belief is rooted in history: a Death Cross preceded many bearish events, including recessions, in the past quarter century.
- March 2000: The Dot-Com crash occurred after the Death Cross ushered in a bear market and recession.
- December 2007: The Global Financial Crisis occurred after the Death Cross ushered in a bear market and recession.
- December 2018: The Federal Reserve (Fed) started tightening interest rates as the Death Cross formed.
- April 2020: The COVID-19 pandemic occurred, but the April 2020 Death Cross formed just after markets bottomed.
- March 2022: The Fed started hiking interest rates, triggering a market correction as the Death Cross formed, preceding the bear market in June 2022.
The current Death Cross occurred on April 14, 2025. The big question is, where do we go from here?
What’s Driving the Market Selling?
This 2025 Death Cross doesn’t exist in a vacuum.
The primary reason for the market selloff has stemmed from President Trump's tariffs, which have reignited trade tensions with China and continue to fan the flames of recession fears.
First-quarter 2025 earnings season is underway, but companies in the consumer staples sector—like the nation's largest importer Walmart Inc. (NYSE: WMT) and major air carrier Delta Air Lines Holding (NYSE: DAL)—have both withdrawn their guidance to brace for economic uncertainty caused by tariffs.
In addition, the Bank of Atlanta has a real-time GDP estimate tracker that investors can monitor.
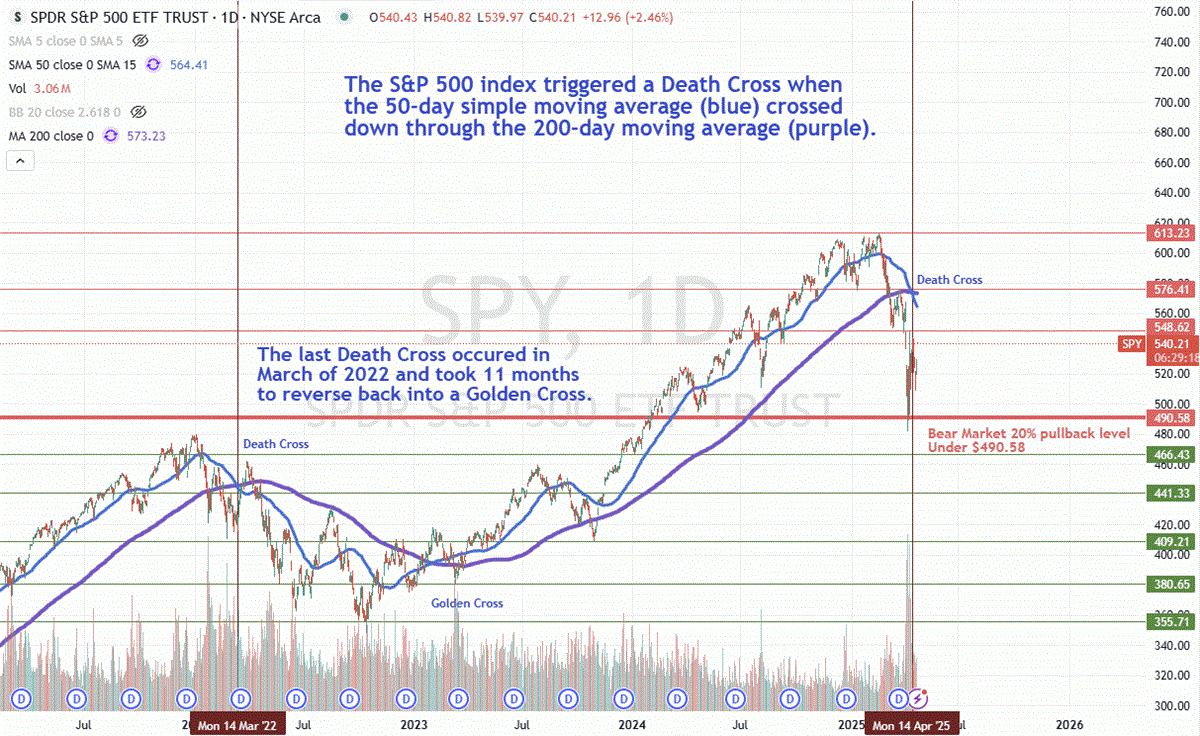
The S&P 500 Index Death Cross Has Begun
On April 14, 2025, the S&P 500 Index officially triggered the Death Cross as the 50-day short-term SMA crossed below the 200-day longer-term SMA. Once these form, they can take some time to reverse. The last Death Cross formed just over three years ago on March 14, 2022, and took 11 months to reverse back into a Golden Cross in February 2023.
A key floor price level to pay attention to is the $490.58, which is the 20% bear market pullback from the highs. The bulls were able to immediately deflect a breakdown attempt there on April 7, 2025. If the SPY falls under $490.58, then keep an eye on the calendar as an official bear market confirms after 60 days below the bear market price level.
Further pullback support levels are at $441.33, $409.91, $380.65 and $355.71 near the last Death Cross bottom.
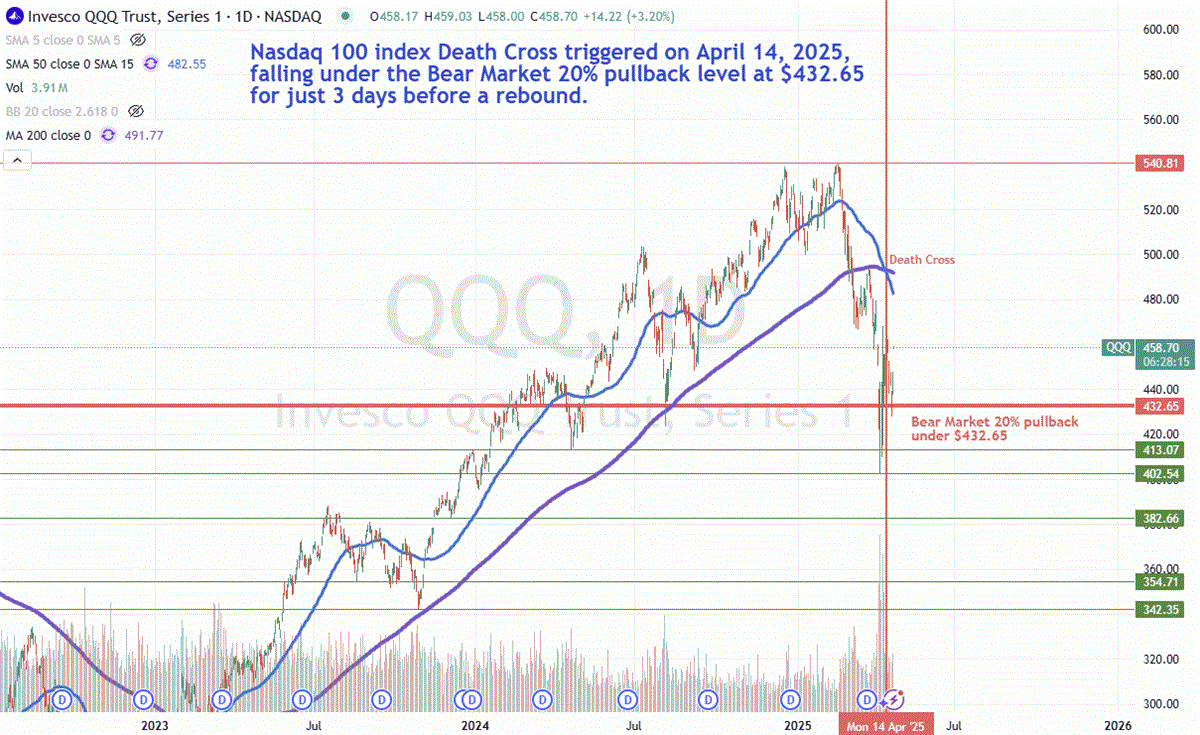
The Nasdaq-100 Index Death Cross Follows
The Death Cross formed simultaneously for the Nasdaq-100 Index and the S&P 500 index on April 14, 2025. The selling on the Nasdaq-100 was very sharp and pronounced as it collapsed under the Bear Market pullback level at $432.65 for three days, surging back up and over it on the fourth day.
The computer and technology sector heavy Nasdaq-100 gained significantly with its Magnificent 7 stocks on the way up and collapsed sharper than the S&P 500 Index on the way down.
Key support levels beneath the Bear Market price level of $432.65 are $413.07, $402.54, $382.55, $354.71 and $342.35.
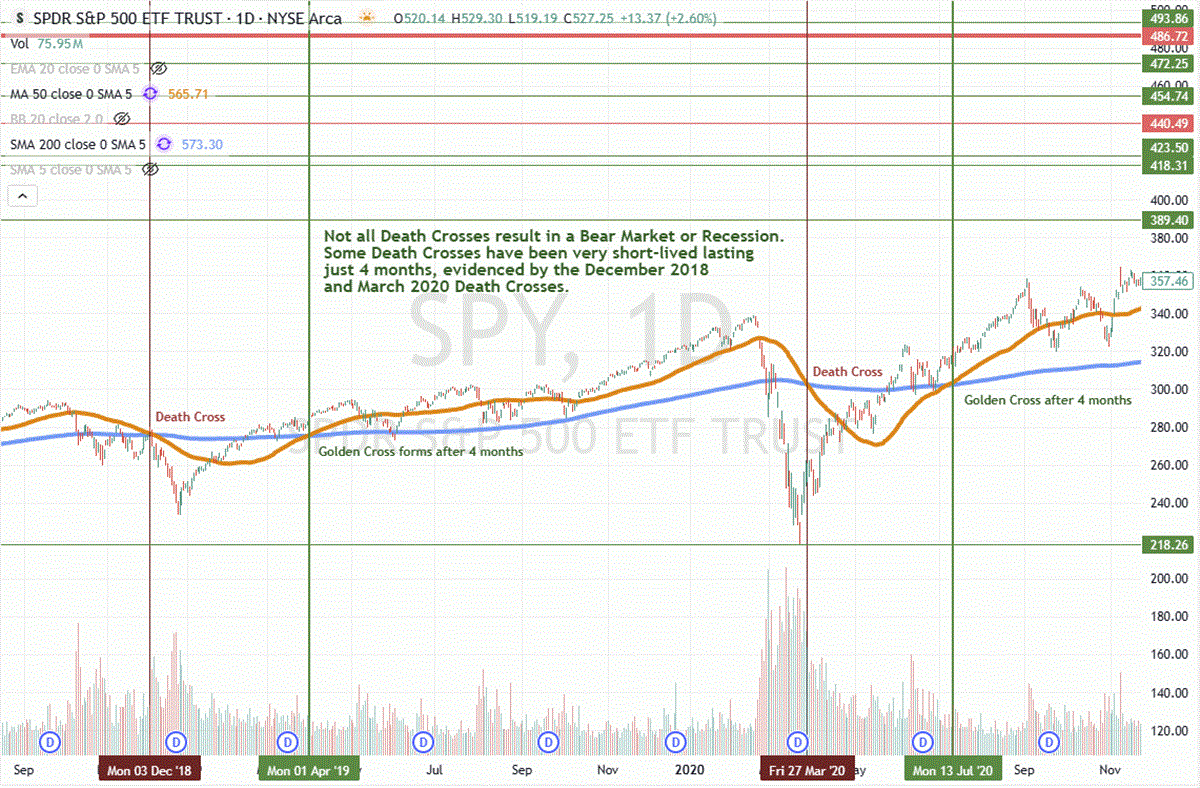
Not All Death Crosses End in Doom
Death Crosses are not the end of the world.
All markets need a breather, and these sell-offs have always resulted in higher markets after the Death Cross reverses back to a Golden Cross when the 50-day SMA crosses back up through the 200-day SMA.
History has proven that some Death Cross formations can be short-lived. Two examples of four-month Death Crosses are the December 2018 Death Cross that reversed back to a Golden Cross in April 2019 and the March 2020 COVID-19 pandemic Death Cross that reversed to a Golden Cross just four months later in July 2020.
The key element is panic. Both Death Crosses formed a very sharp drop followed by a sharp bounce, forming a V-bottom. The pandemic Death Cross actually formed as the market was putting in a bottom.
The sharper and faster the drop, the quicker and faster the reversal can happen.
Catalysts for this can include the conclusion of the trade war, interest rate cuts, positive economic reports, falling inflation, strong earnings season, artificial intelligence (AI) ramp-up near the end of 2025, and positive geopolitical outcomes.
Learn more about SPY