Goldman Sachs: Raises the Bar for Banks After Crushing Q3 2024
Investment bank The Goldman Sachs Group Inc. (NYSE: GS) reported another stellar performance in its third quarter of 2024. The firm continues to divest and shed consumer-centric assets, including its credit card partnerships, personal loan portfolios, and consumer lending products, to double down on its investment banking and wealth management. Its Asset & Wealth Management segment revenue jumped 16% YoY as assets under supervision (AUS) surged to $3.10 trillion, driving record management fees of $2.62 billion.
The firm is reaping the benefits of a more active IPO and underwriting market, which should continue to strengthen with the interest rate cut cycle. Its top and bottom line beat sets the gold standard for banks, raising the bar for peers in the finance sector, including Morgan Stanley (NYSE: MS) and JPMorgan Chase & Co. (NYSE: JPM).
Investment Bank vs. Consumer Retail Bank Performance
It's interesting to note that as an investment bank, Goldman Sachs is reporting strengths and weaknesses in opposite areas as consumer-centric money center banks like Wells Fargo and Co. (NYSE: WFC). For example, Wells Fargo saw an 11% YoY drop in net interest income in its Q3 2024, whereas Goldman Sachs saw its net interest income surge 70% YoY to $2.62 billion in the same period.
Wells Fargo saw its investment banking revenues drop 2.56% YoY to 419 million. In contrast, Goldman Sachs saw investment banking fees surge 20% YoY to $1.87 billion, leading the world as the number one firm for mergers and acquisitions and common stock offerings in the quarter. The investment banking backlog continues to grow each quarter as the interest rate cut cycle begins.
However, Goldman Sachs's fixed income, currency, and commodities (FICC) revenue declined 12% YoY to $2.96 billion due to lower revenue in commodities and interest-rate products. Wells Fargo saw a 16% jump in FICC fees. Goldman had tough comps as FICC revenue had outperformed in Q3 2023.
Investment Banking and Wealth Management Surge
Focusing back on its core strengths, Goldman was a major benefactor in the recovery of IPOs and mergers and acquisitions. In its third quarter of 2024, Its Asset & Wealth Management segment generated $3.75 billion in revenues as AUS rose $169 billion to a record $3.10 trillion. Its Global Banking and Markets segment revenue rose 7% to $8.55 billion. Advisory revenue rose 5% YoY to $875 million. Equity underwriting fees surged 25% YoY to $385 million, driven by an active IPO market. Investment Debt underwriting fees rose 46% YoY to $605 million.
Goldman Sachs Crushes Again
For its third quarter of 2024 results, Goldman Sachs reported an EPS of $8.40, beating analyst estimates by $1.61. Revenues rose 7.4% YoY to $12.7 billion, crushing analyst estimates of $11.77 billion by nearly $1 billion. The company maintained its full-year 2024 forecasts and approved a $3.00 per share dividend payout to shareholders of record on Dec. 2, 2024, to be paid out on Dec. 30, 2024.
Goldman Sachs CEO David Solomon commented, “As I look at the operating backdrop, the U.S. economy continues to be resilient. Inflation has been coming down, the recent unemployment data is supportive, and while we have seen some softness in consumer behavior, the tone of my recent conversations with clients has been quite constructed. The beginning of the rate cut cycle has renewed optimism for a soft landing, which should spur increased economic activity.”
GS Stock Triggers an Ascending Triangle Breakout
An ascending triangle is comprised of a flat-top upper trendline resistance converging with an ascending lower trendline support. The breakout occurs when the stock surges through the upper trendline resistance, which becomes a new support level.
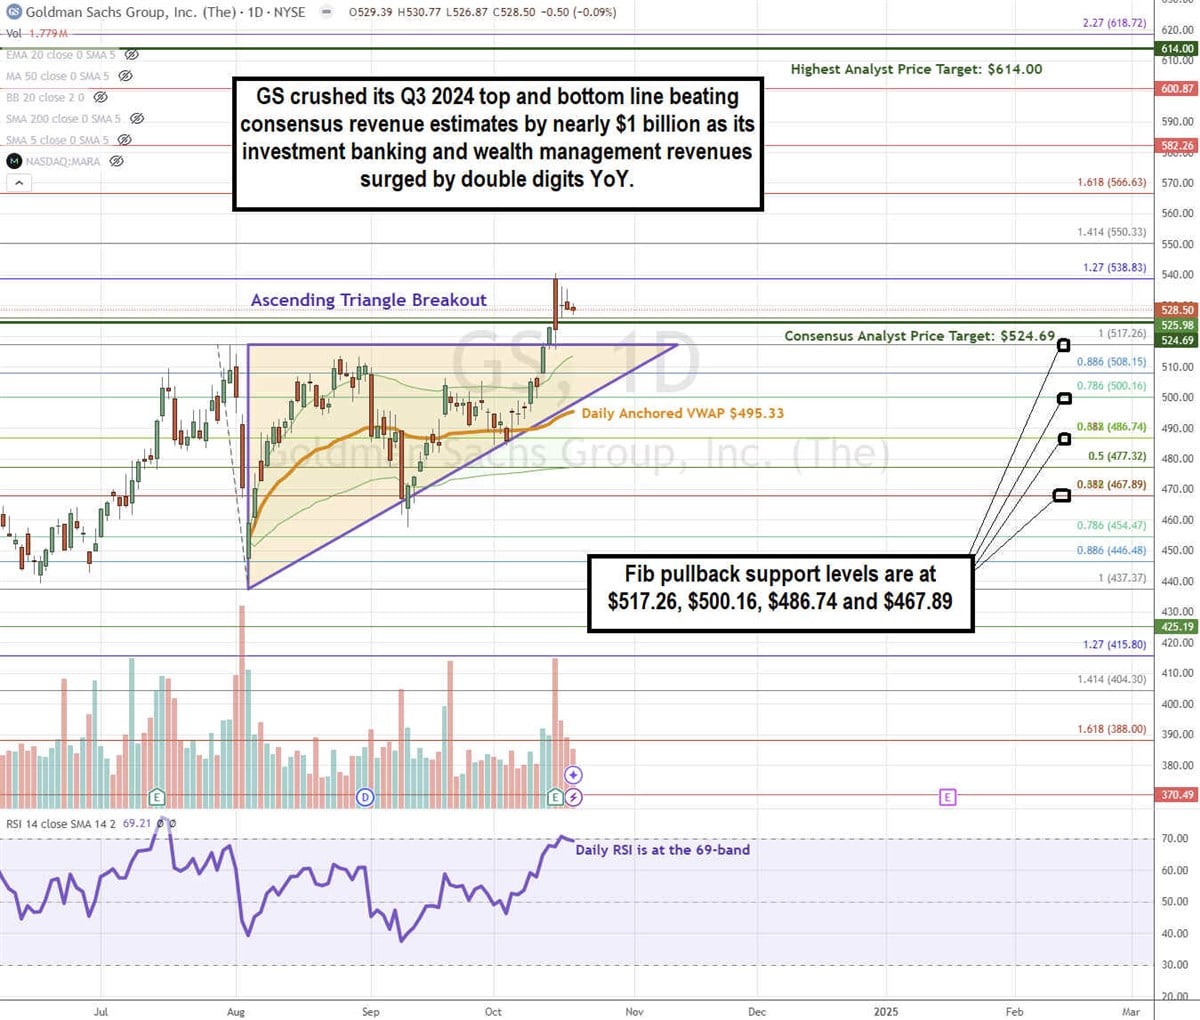
GS triggered the ascending triangle breakout through the $517.26 flat-top resistance on its earnings beat. Shares surged through the $528.83 Fib level before a reversion and potential market structure high (MSH) sell trigger under $525.98. The daily anchored VWAP support is at $495.33.
As the daily RSI rose to the overbought 76-band. The daily anchored VWAP support is at $57.11. Fibonacci (Fib) pullback support levels are at $517.26, $500.16, $486.74, and $467.89.
Goldman Sach’s average consensus price target is $524.68, and its highest analyst price target sits at $614.00. It has 14 analysts' Buy ratings and five Hold ratings. The stock trades at 14.88x forward earnings.
Actionable Options Strategies: Bullish investors can consider using cash-secured puts to buy GS at the Fib pullback support levels for entry and write covered calls to execute a wheel strategy for income in addition to the 2.27% annual dividend yield.
Learn more about GS